Office of Institutional Analytics
COACHE Contacts & FAQ
Project Leaders |
Faculty Advisors |
|---|---|
|
|
If you have any concerns about data privacy of survey response data, please email Meghal Parikh.
FAQ
Have questions? Let us know, and we'll add and answer them.
- What is COACHE?
- What does the survey ask?
- How long does the survey take? Do we have to complete it in one sitting?
- Who will see the survey responses?
- How can we be assured that our individual responses won't be identifiable by campus colleagues?
- How will the results be used?
- In what form will the campus receive the results?
- What's the timeline for the survey administration, reporting, and action?
- How will we know when changes have been made as a result of the survey feedback?
- What are our comparison institutions?
- What was our response rate?
See the FAQ for Faculty from COACHE for more.
What is COACHE?
COACHE is The Collaborative on Academic Careers in Higher Education, a research-practice partnership based in the Harvard Graduate School of Education. COACHE studies the work lives of faculty with a focus on actionable data to support academic administrators. Studies are conducted in partnership with college and university leaders (both faculty and administrative) with an emphasis on using the data collected to improve the academic workplace.
What does the survey ask?
The COACHE survey asks faculty about their satisfaction with following:
- teaching, research, and service (ie, time, sense of balance, support / resources, interdisciplinary / collaborative work, advising, faculty mentoring),
- tenure and promotion (ie, culture, clarity of expectations, plans for applying for promotion)
- institutional governance and leadership (ie, mission / priorities, communication & action, satisfaction with specific leaders, shared governance & faculty voice, recognition & appreciation),
- departments (ie, engagement, interactions & satisfaction with colleagues),
- work-life balance,
- recruitment & retention (ie, outside searches & offers, plans & priorities for retention), and
- overall satisfaction with the institution, your department, and the job.
Read the original survey (without custom questions added by Rollins).
How long does the survey take? Do we have to complete it in one sitting?
It should take approximately 25 minutes to complete the survey. You may do it in one sitting--or you can save and restart where you left off, or restart from the beginning.
Who will see the survey responses?
Meghal Parikh (Rollins College’s Director of Institutional Analytics and designated Data Administrator, who acts as an honest broker of sensitive personnel data swearing responsibility for protecting the identities of respondents) is the only person at Rollins who will have access to the disaggregated data, which will come in a de-identified unit record data file (SPSS format).
Everyone else will see only high-level reports.
How can we be assured that our individual responses won't be identifiable by campus colleagues?
Meghal Parikh is preparing an explanation and example of the reporting, so you can see the level of detail that will (and won't) be released to campus.
In addition, most questions (if not all) allowed the participant to choose “not applicable” or “prefer not to answer."
How will the results be used?
Survey results will be used to help Rollins document and understand the issues important to faculty, such as the following:
- how faculty at different career stages experience academic work life at Rollins College,
- how their experiences compare to those of faculty at peer institutions,
- whether experiences differ by rank, tenure status, discipline, gender, or race/ethnicity, and
- what policies or practices are associated with high levels of faculty satisfaction.
Survey results will also be used to act based on the findings. Some issues that emerge may be dealt with swiftly, while others will become opportunities for broad involvement in designing collaborative solutions.
In what form will the campus receive the results?
COACHE delivers the results in two formats.
- A summary PDF report looks at high level results and global questions. See the report here.
- A full digital report disaggregates results by race, gender, rank, tenure status, and discipline.
What's the timeline for the survey administration, reporting, and action?
The pandemic has altered the original timeline, so see the new and more detailed timeline here.
How will we know when changes have been made as a result of the survey feedback?
The Project Leaders will be sharing regular updates on post-survey responses and progress. Faculty Advisors were selected in part to ensure the consistency and clarity of these communications. Action Groups and relevant others will be tasked with leading responses to survey and will keep the Leadership Team updated on processes, recommendations, and accomplishments.
What are our comparison institutions?
Rollins selected 5 institutions as peers against whom to assess our COACHE Survey results:
- Agnes Scott College (2020)
- Davidson College (2020)
- Gettysburg College (2020)
- Kenyon College (2018)
- Muhlenberg College (2020)
Faculty from the following 27 institutions comprise the comparison cohort of liberal arts colleges for the 2020 Chief Academic Officer Report.
- Agnes Scott College (2020)
- Amherst College (2020)
- Babson College (2019)
- Barnard College (2017)
- Bates College (2018)
- Centre College (2020)
- Colgate University (2018)
- Davidson College (2020)
- Gettysburg College (2020)
- Hamilton College (2018)
- Harvey Mudd College (2020)
- Juniata College (2020)
- Kenyon College (2018)
- Lafayette College (2020)
- Manhattan College (2019)
- Mills College (2020)
- Mount Holyoke College (2020)
- Muhlenberg College (2020)
- Occidental College (2018)
- Ohio Wesleyan University (2019)
- Saint Mary's College of Maryland (2017)
- The University of the South (2018)
- University of North Carolina-Asheville (2018)
- Ursinus College (2020)
- Washington and Lee University (2020)
- Wellesley College (2020)
- Wofford College (2020)
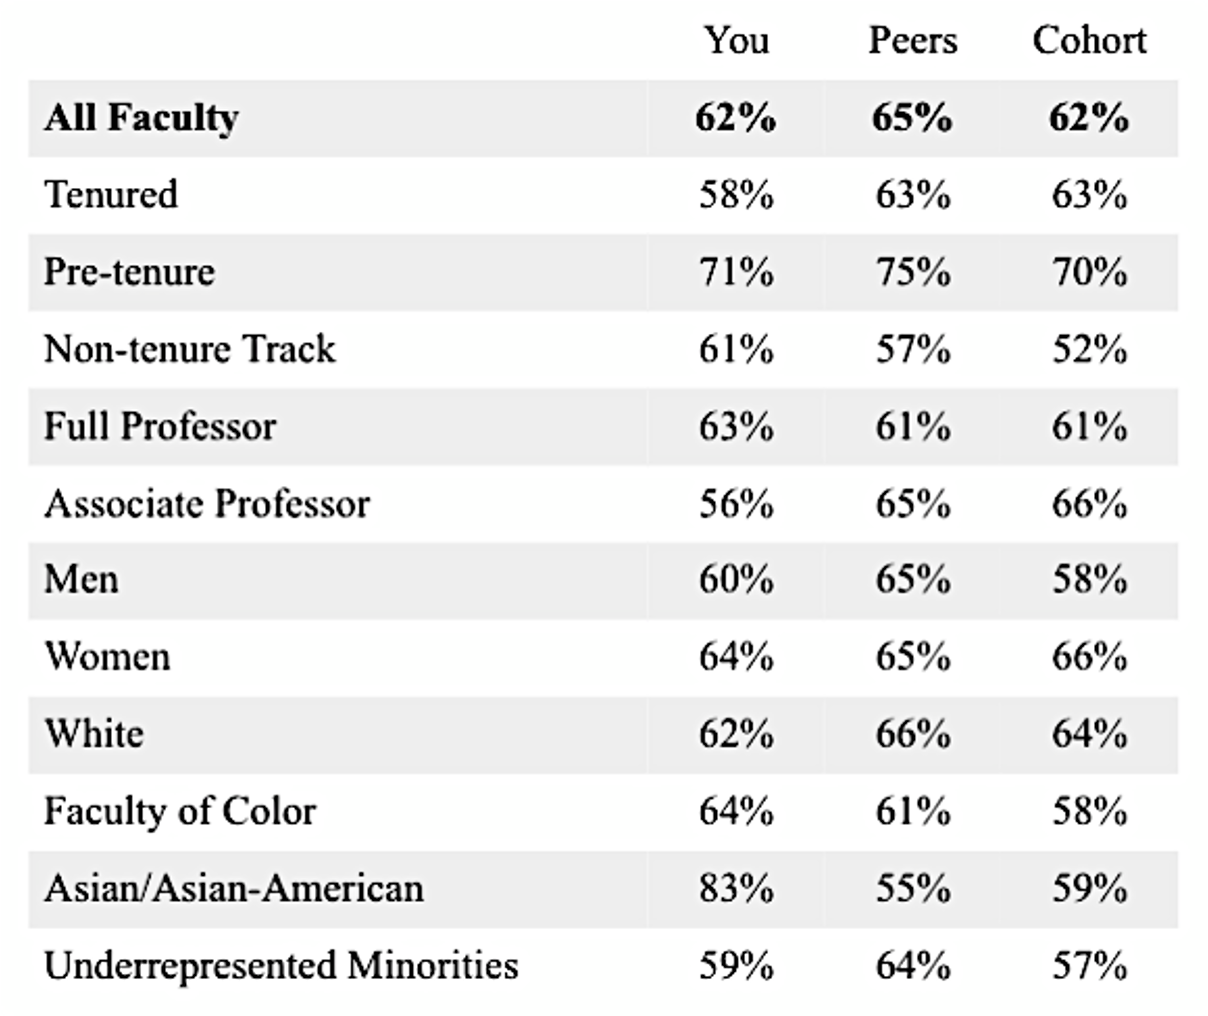
What was our response rate?
The overall response rate for Rollins College faculty was 62%. The College of Liberal Arts had a 61% response rate, and the Crummer Graduate School of Business's response rate was a 70%.
A breakdown of response rates by group is available in the image below, or view this PDF.